

LendingTree is compensated by companies on this site and this compensation may impact how and where offers appear on this site (such as the order). LendingTree does not include all lenders, savings products, or loan options available in the marketplace.
Average Car Payment | Loan Statistics 2022
Editorial Note: The content of this article is based on the author’s opinions and recommendations alone. It may not have been reviewed, commissioned or otherwise endorsed by any of our network partners.
The average car payment for new vehicles is a record-high $644, a double-digit percentage increase from the prior year. Not to be outdone, average car payments for used and leased vehicles are rising at even higher levels.
To get a full picture of U.S. auto loan debt and trends, LendingTree looked at payments, originations, term lengths, delinquencies and more. Here’s our 2022 roundup of auto loan statistics.
Auto loan statistics 2022: Average car payments to financing by credit score
- Average car payments in the U.S. increased year over year by double-digit percentages. The jumps were 11.8% for new vehicles, 18.2% for used vehicles and 15.4% for leased vehicles, putting average monthly car payments at $644, $488 and $531, respectively.
- The double-digit increases continue with vehicle prices. New vehicle prices are up 12.2% year over year, but used car and truck prices are up substantially more at 40.5%. To pay for this, Americans borrow an average of $39,721 for new vehicles and $27,291 for used vehicles.
- Auto loan debt is the third-largest debt category behind mortgages and student loans. Overall, Americans owe $1.46 trillion in auto loan debt, accounting for 9.4% of American consumer debt.
- On average, Americans take out more than $60 billion in new auto loans each month. By age, Americans younger than 50 take out $37.9 billion in auto debt monthly, compared with $21.0 billion by those 50 and older.
- Americans are taking many years to pay back their auto loans. The average auto loan term is 69.7 months for new cars, 67.4 months for used cars and 36.8 months for leased vehicles.
- Auto loan delinquency rates continue to drop across the board. 4.0% of outstanding auto debt is at least 90 days late — down from 5.3% in 2010 — while another 5.0% are 30 days overdue — down from 10.9% in 2009.
- Borrowers with prime credit scores are responsible for the majority of retail vehicle financing. Borrowers with 661-plus scores account for 65.2% of retail vehicle financing, versus 16.0% for subprime borrowers.
Sources: Experian, U.S. Bureau of Labor Statistics, Federal Reserve Bank of New York, Edmunds, Consumer Financial Protection Bureau
TABLE OF CONTENTS
- Average monthly car payments
- Vehicle prices
- Average auto loan amounts
- Auto loan debt
- Auto loans as a percentage of American consumer debt
- Volume of auto loan originations
- Auto loan originations by borrower age
- Auto loan originations by credit score
- Number of monthly auto loan originations
- Average auto loan terms
- Auto loan delinquency rates
- Types of lenders financing auto loans
Average monthly car payments for new, used and new leased vehicles spike year over year
The average car payment for a new vehicle is $644 monthly (up 11.8%), while new lease payments average $531 (up 15.4%). But despite having the largest jump in price at 18.2%, used cars still have the lowest average monthly payments at $488.
Annual changes in average monthly car payments
| 2020 payments | 2021 payments | Difference ($) | Difference (%) | |
|---|---|---|---|---|
| New vehicles | $576 | $644 | $68 | 11.8% |
| Used vehicles | $413 | $488 | $75 | 18.2% |
| New leased vehicles | $460 | $531 | $71 | 15.4% |
Source: Experian State of the Automotive Finance Market, Q4 2020 and Q4 2021
In general, the worse your credit score, the higher your monthly car payment. But that’s not always the case. Those with credit scores of 601 to 660, in the nonprime or (fair) range, saw the highest average monthly payments for new vehicles at $677.
Average monthly payments by credit score range
| New vehicles | Used vehicles | New leased vehicles | |
|---|---|---|---|
| All | $644 | $488 | $531 |
| 781 to 850 | $613 | $464 | $520 |
| 661 to 780 | $651 | $480 | $533 |
| 601 to 660 | $677 | $505 | $542 |
| 501 to 600 | $666 | $507 | $540 |
| 300 to 500 | $626 | $497 | N/A |
Source: Experian State of the Automotive Finance Market, Q4 2021
Increase in new car payments similar to hike in new vehicle prices
The 11.8% hike in the average new car payment is nearly identical to the new vehicle price increase of 12.2%. The coronavirus pandemic caused factory shutdowns and supply chain shortages, dwindling the vehicle supply even as demand recovered quickly.
In January 2022, most new vehicles sold for more than their manufacturer’s suggested recommended price (MSRP) — in particular, select luxury brands commanded thousands more. The used car market is no friendlier to consumers, as used car prices rose by 40.5%.
Average auto loan amounts near $40,000 for new vehicles
Average auto loan amounts have steadily increased in the past decade, reaching $39,721 for new vehicles and $27,291 for used vehicles.
New car buyers in the nonprime/fair credit tier (601 to 660) have the largest loans — $41,843, on average. Borrowers with credit scores in the tier above — prime (661 to 780) — take out the most for used cars, $29,065, which is considerably above how much they borrowed last year ($22,708).
Average auto loan amounts by credit score range
| New vehicles | Used vehicles | |
|---|---|---|
| All | $39,721 | $27,291 |
| 781 to 850 | $36,261 | $27,722 |
| 661 to 780 | $41,352 | $29,065 |
| 601 to 660 | $41,843 | $27,473 |
| 501 to 600 | $37,657 | $22,818 |
| 300 to 500 | $32,399 | $19,253 |
Source: Experian State of the Automotive Finance Market, Q4 2021
Americans owe $1.46 trillion in auto loan debt
Overall vehicle debt nearly doubled between the fourth quarter of 2011 ($734 billion) and the fourth quarter of 2021 ($1.46 trillion).
In these 10 years, the only dip came in the second quarter of 2020 — the first full quarter amid the pandemic. That quarter, Americans owed $1.34 trillion, down from $1.35 trillion the prior quarter.
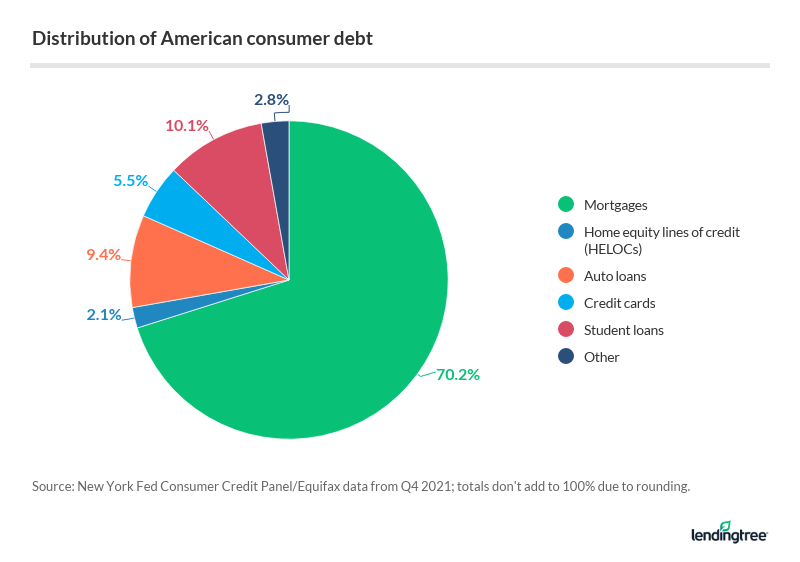
Auto loans account for 9.4% of American consumer debt
While mortgages take the lion’s share of American consumer debt at 70.2%, auto loans account for 9.4% — just below student loan debt at 10.1%.
Americans borrow more than $60 billion a month in auto loans
Ten years ago, Americans took out nearly $30 billion a month in auto loans. Today, they borrow more than double that, at over $60 billion a month. Here’s a quarterly look:
Americans in their 30s, 40s take out biggest auto loans
Americans in their 30s and 40s took out the largest auto loans in the fourth quarter of 2021, borrowing $41.4 and $42.3 billion, respectively.
Those in their 50s borrowed about $10 billion less ($33.2 billion), followed closely by young adults ages 18 to 29 who borrowed $29.9 billion. The oldest generations borrowed the least.
When you break it down monthly over that fourth quarter of 2021, Americans younger than 50 took out $37.9 billion in auto debt monthly. This compares to $21 billion by those 50 and older.
Americans with highest credit scores take out biggest auto loans
Meanwhile, those with the best credit scores borrow the most. In 2021, borrowers with credit scores of at least 720 took out $360.1 billion in auto loan debt. The remaining credit tiers accounted for $373.9 billion combined.
Auto loan originations by credit score (billions)
| Less than 620 | 620 to 659 | 660 to 719 | 720 to 759 | 760+ | |
|---|---|---|---|---|---|
| 1Q 2021 | $23.3 | $17.2 | $32.8 | $23.5 | $55.9 |
| 2Q 2021 | $35.2 | $23.3 | $45.1 | $31.1 | $67.2 |
| 3Q 2021 | $33.8 | $23.7 | $45.6 | $32.5 | $63.2 |
| 4Q 2021 | $30.9 | $22.3 | $40.7 | $27.9 | $58.8 |
Source: Experian State of the Automotive Finance Market
The median credit score of auto loan borrowers when they originated a loan has been above 674 since 2005.
Pre-pandemic, Americans were taking out more than 2.3 auto loans a month
The number of auto loans Americans took out in April 2019 — the latest available data — is 110% higher than at its lowest point in the Great Recession in 2008. This will be an interesting trend to track further as pandemic-era data becomes available.
Average auto loan term shows it’s taking time to pay back these loans
The average auto loan term for new vehicles is 69.7 months, or nearly six years. Used car loans, despite being significantly smaller on average, are close behind at 67.4 months.
Average term lengths by credit score range (in months)
| New vehicle loans | Used vehicle loans | New leased vehicles | |
|---|---|---|---|
| All | 69.7 | 67.4 | 36.8 |
| 781 to 850 | 64.3 | 64.9 | 35.9 |
| 661 to 780 | 71.1 | 68.5 | 37.1 |
| 601 to 660 | 74.3 | 68.4 | 37.4 |
| 501 to 600 | 73.7 | 65.5 | 36.8 |
| 300 to 500 | 72.3 | 61.6 | N/A |
Source: Experian State of the Automotive Finance Market, Q4 2021
But auto loans are stretching even longer — topping six years — for nonprime borrowers. Middle-tier credit borrowers take out the longest car loans, an average loan of 74.3 months. Top credit score borrowers have the lowest average loan terms at 64.3 months.
The average new car lease term is 36.8 months, or about three years.
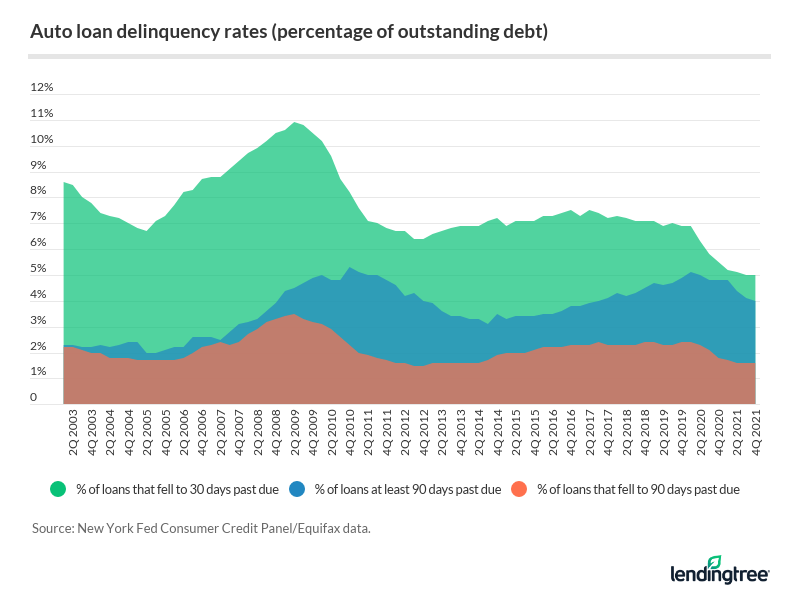
Auto loan delinquency rates continue to drop from peaks
Ninety-day delinquency rates on auto loans peaked in the fourth quarter of 2010 at 5.3%, dropping to 4.0% as of the fourth quarter of 2021.
Meanwhile, 30-day delinquencies spiked to 10.9% in the second quarter of 2009. But they’ve stayed below 8% since 2011 and have decreased to 5.0% in the final quarter of 2021.
Buyers turn to banks the most for auto financing
Although captive lenders eclipsed banks for a short time in 2020, banks top the auto finance market share across the board, backing 31.8% of total retail auto financing. Captive lenders follow at 26.6%, while credit unions are a more distant competitor at 20.9% market share.
“Buy-here, pay-here” businesses, often known for predatory lending practices, capture 17.0% of the used car financing market. In this arena, captive lenders only claim 8.7%.
